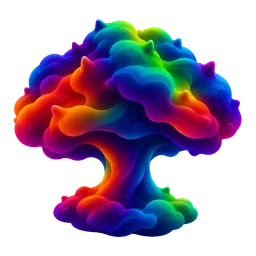
Fractal volume shading
Samples a Mandelbulb-style distance field along every camera ray for a heavy, repeatable workload.
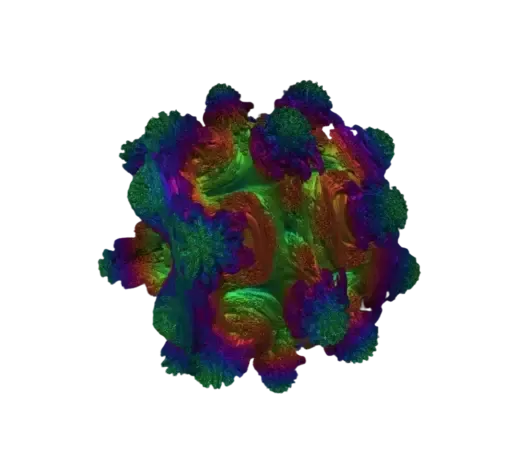
VolumeShader_BM is a GPU benchmark that runs in your browser. It renders a ray-marched Mandelbulb fractal, records per-frame timings and reports average FPS, 1% lows and a frame-rate curve. You will also see it written as volumeshader_bm or volume shader bm, shortened to VSBM. The run and all calculations stay on your device.
VolumeShader_BM is a browser GPU stress and performance benchmark built on volumetric shaders and fractal rendering. Volume refers to volumetric rendering, shader is a small program that runs on the GPU, and BM is usually read as benchmark, meaning a repeatable test that produces a comparable number. Instead of drawing a mesh of triangles, a fragment shader describes a Mandelbulb fractal with a formula. Every pixel casts a ray, samples a three-dimensional distance field step by step, and then works out the surface normal and colour once it hits something. Repeating this over more than a million pixels per frame puts sustained pressure on floating-point throughput and memory bandwidth, which is why the gap between a desktop GPU and a phone chip becomes obvious within seconds. This site keeps the original open-source shader unchanged, fixes the render resolution at 1920×1080 and the kernel iterations at 5, times every frame across a 70-second run, discards the first and last 5 seconds, and reports average FPS, 1% low, minimum FPS and a frame-rate curve. It measures rendering performance under this one browser workload. It does not read temperature, power draw or hardware health, and it is not a substitute for a diagnostic tool.
The test began as a technical demo published on GitHub Pages by the developer cznull at cznull.github.io/vsbm. Several third-party references and an encyclopedia entry name cznull as the publisher of that original demo, and the official FAQ includes a dedicated question about the relationship between cznull and Volume Shader BM. Public sources do not give an exact first-release date or an official version number, so we do not guess here. What is clear is that the demo first circulated among PC hardware enthusiasts, then spread through TikTok, Instagram and Chinese short-video communities because the spinning, brightly coloured shape looks like a mushroom and a few seconds of rendering reveal whether a device performs as advertised. It became a quick way to sanity-check a new phone or a used graphics card. Today volumeshaderbm.com offers the web test, free Android and iOS apps, optional anonymous score sharing and several leaderboards. A number of related sites have grown around the same shader, each adding complexity presets, WebGL2 or WebGPU support and data-quality notes. This site is an independent community project, not the official site and not affiliated with the original author. We keep the original rendering kernel and add a shared preset plus a stable measurement window so devices can be compared under identical conditions.
The test ships four presets, from lightest to heaviest: Simple (2 fractal iterations × a 250-step ray-marching cap), Standard (5 × 1002), Advanced (7 × 1500) and Extreme (9 × 2000). The default Standard preset matches the classic original Volume Shader BM parameters exactly, so scores stay directly comparable. All four share the same fixed constants — SOLVER and MAXR refinement at 8 passes each, a 0.002 step size and a 1.6 camera distance — so switching tiers only changes those two core parameters.
VolumeShader BM is a GPU stress and performance benchmark built around a computationally intensive volumetric fractal shader scene. In plain words: it asks your graphics card to draw a math-generated, mushroom-shaped scene frame by frame right in the browser — the faster and steadier it draws, the higher the score.Your browser renders a repeatable ray-marched scene in real time. We record per-frame timings and, after discarding start-up and wind-down noise, compute average FPS, 1% lows and stability. Explore the original project ↗
Every pixel runs a dense sequence of calculations, making small differences in GPU compute power visible.
01 for (float i = 0.0; i < STEPS; i++) 02   vec3 p = origin + ray * depth;
03   density += sampleVolume(p);
04   depth += STEP_SIZE;
05
Samples a Mandelbulb-style distance field along every camera ray for a heavy, repeatable workload.
Executes many sequential sampling steps and bisection solves per pixel to magnify compute differences.
Runs directly on the graphics processor through the browser native graphics API — no plugins.
Records frame intervals and GPU time to derive average FPS, 1% lows and variance.
The table below follows the order in which terms appear on this page, and matches the test code item by item.
| Term | Definition | Role in this test |
|---|---|---|
| Volume shader | A GPU program that runs per pixel inside the fragment shader and describes the whole 3D scene with formulas. | Carries the entire compute load of the test. |
| Ray marching | Samples the volume step by step along each view ray until it hits a surface. | Turns every pixel into a long chain of calculations, separating GPUs. |
| Frame time / FPS | Time for one frame and frames per second. | Core score metrics, recorded every frame. |
| 1% Low | The mean of the slowest 1% of frame times, converted to FPS. | Reflects stutter and stability. |
| STEPS (max march steps) | Upper bound of ray-march samples per pixel; 1002 under the standard preset. | Together with iterations, sets the per-pixel compute cost. |
| STEP_SIZE (step length) | The stride of each march step, fixed at 0.002. | Identical sampling density on every device keeps scores comparable. |
| Mandelbulb / distance field | A formula-defined 3D fractal that returns an approximate distance to the surface. | A repeatable, high-complexity scene with no asset files. |
| Iterations (fractal iterations) | How many times the Mandelbulb formula runs per sample; 5 under the standard preset. | The second source of per-sample cost, paired with STEPS. |
| SOLVER / MAXR (hit refinement) | 8 bisection passes after a hit, plus an 8-pass extremum search. | Sharpens the image and adds to the workload itself. |
| WebGL (WebGL1 here) | The browser graphics API used to reach the GPU. | Renders in the page without plugins. |
| gpu_ms (GPU frame time) | Elapsed time around gl.finish(), i.e. pure rendering time. | Tells whether a result is capped by the refresh rate. |
No device category to pick. We detect the environment, record device info, apply one shared preset and take care of the measurement.
Three things that make this an online tool you can open and run immediately.
Open the page and run. The benchmark and all calculations stay in your browser.
Desktops, laptops, phones and tablets all run the same standard preset.
Because it runs in the browser, hardware on Windows, macOS, Android and iOS can all run the same preset, so results are directly comparable.
A fast, repeatable way to check the performance changes that matter to your system.
After installing a new card, run the standard preset once and check whether average FPS sits in the usual range for that model. Compare your number with a friend on the same GPU, then look at drivers and power cables if the gap is large. One run cannot prove a card is genuine, but it quickly shows whether something is misconfigured. Close other GPU-heavy apps first.
A fresh build can hide cooling, power or driver problems that only appear under sustained load. Run the full 70 seconds and watch whether the frame-rate curve stays flat or drops suddenly. A decline in the second half usually means thermal throttling, so check airflow and thermal paste before blaming the card. Do not run a game or a video encode at the same time.
After changing core clock, voltage or a power limit, run once under the same preset and compare average FPS with 1% low. Going from 48 to 53 FPS while 1% low falls from 40 to 28 means higher peaks but more stutter. That comparison is more useful than a single best frame. Change one setting at a time so you know which step caused the difference.
The same mobile GPU can perform very differently across power modes and cooling setups. Run once plugged in and once on battery; a clear drop in average FPS usually comes from the power policy rather than the hardware. You can also compare before and after cleaning the fans to see whether throttling still appears. Keep the laptop flat and leave the air intake clear.
Before buying a used card, ask the seller to run the same browser and preset and check for artefacts, colour blocks or driver crashes. Stripes appearing on two consecutive runs are a reason to investigate the memory, and a score well below the same model deserves a question about its history. A low score is only a clue, never proof of a fake or ex-mining card. A full diagnosis needs proper hardware tests.
Driver versions, browser versions and the hardware-acceleration switch all affect WebGL performance. If a driver update costs you 10% of the score, run once on the old version and once on the new one before rolling back. Browser upgrades and toggling hardware acceleration are worth the same check. Record the preset version and environment each time, otherwise the comparison means little.
ⓘ This tool is for reference only and does not replace professional testing or hardware diagnostics.
Wondering where your own result lands? Below are the top three average-FPS entries per class — PC, Android and Apple — from the standard preset, as reference anchors.
All scores below use the Standard preset: 5 fractal iterations and a 1002-step ray-marching cap, with SOLVER and MAXR refinement at 8 passes each and a fixed 0.002 step — the classic original Volume Shader BM parameters. Figures come from publicly available data and are independent of this project's own board. Sample sizes and vendor driver updates shift results over time, and some devices may not be listed, so treat them as reference only.
| Rank | Device / GPU | Avg FPS | Median | Best | Samples |
|---|---|---|---|---|---|
| 1 | NVIDIA GeForce RTX 5090 | 197.4 | 149.9 | 538.4 | 16 |
| 2 | NVIDIA GeForce RTX 5080 | 143.4 | 110.1 | 401.2 | 181 |
| 3 | AMD Radeon RX 7900 XT | 140.2 | 122.7 | 211.1 | 7 |
| Rank | Device / GPU | Avg FPS | Median | Best | Samples |
|---|---|---|---|---|---|
| 1 | Adreno 650Snapdragon 865 / 870 | 27.0 | 32.8 | 33.8 | 12 |
| 2 | Xclipse 960Exynos 2400 | 4.0 | 4.2 | 10.0 | 51 |
| 3 | Xclipse 540Exynos 1480 | 3.8 | 1.0 | 60.3 | 40 |
| Rank | Device / GPU | Avg FPS | Median | Best | Samples |
|---|---|---|---|---|---|
| 1 | Apple M5 GPU | 4.5 | 3.9 | 60.8 | 96 |
| 2 | Apple A20 Pro GPU | 3.4 | 3.2 | 9.6 | 400 |
| 3 | Apple M4 GPU | 2.7 | 2.9 | 4.8 | 94 |
Different GPU tools apply very different loads and answer different questions. The table below puts VolumeShader_BM next to five popular benchmarks, followed by a short summary of the key differences.
Compiled from each vendor's public documentation; platforms change between versions, so check the official pages for details. The key differences come down to two things. On installation and convenience, VolumeShader_BM needs zero installation and runs the moment you open the page, directly in the browser, while traditional tools such as 3DMark and FurMark usually require a client download and can take up significant disk space. On focus, the mushroom test leans on floating-point and trigonometric fractal volumetric rendering at light-to-moderate pressure, which makes it highly sensitive to mobile chips (phone GPUs) and browser WebGL scheduling; FurMark is a pure power and thermal torture test that pushes the GPU to 100% TDP to reveal temperatures and clock throttling; 3DMark is the most complete game-oriented performance simulation, covering ray tracing and modern APIs; and Blender Benchmark targets productivity and 3D rendering, where VRAM capacity (12GB, 16GB, 24GB) matters a great deal.
| Tool | Platforms | How it works and what load it applies | Key metrics | Typical use cases |
|---|---|---|---|---|
VolumeShader_BMthe "poison mushroom" test | Browser (WebGL); official Android / iOS apps | Renders a 3D volumetric shader via ray marching over a Mandelbulb fractal | Average FPS, live frame rate, 1% lows, minimum FPS, frame-rate curve | Quick cross-platform scoring, phone and thin-laptop GPU comparisons, thermal-throttle and stutter checks |
3DMarkindustry standard | Windows, Android, iOS | Simulates real 3D game-engine scenes (DirectX 12, Vulkan, ray tracing, DLSS/FSR) | Overall graphics score, physics/CPU score, frame-rate curve | PC gaming GPU evaluation, before/after overclocking, the authoritative score for new-card checks |
FurMarkthe "donut" stress test | Windows (OpenGL) | Extreme fur and ring-tessellation OpenGL rendering that creates a full-load, high-power workload | GPU core and VRAM temperatures, power percentage, live/average FPS, overheat alarms | Maximum stress testing, cooler validation, power-delivery and stability checks |
Unigine Superposition | Windows, Linux | Highly detailed, extremely complex photoreal 3D scene fly-throughs and shader rendering | Extreme-mode FPS, min/max frame rate, VR score, GPU temperature | Extreme load, overclock-limit hunting, VR performance evaluation |
Blender Benchmark | Windows, macOS, Linux | Real Blender scenes rendered by the Cycles / Eevee engines (path tracing, volumetric light) | Scene render time (samples/min or total seconds) | GPU picks for 3D artists, film post-production and render/AI workstations (VRAM capacity and CUDA/OptiX throughput matter most) |
Geekbench 6GPU compute | Windows, macOS, Linux, iOS, Android | Broad OpenCL / Metal / Vulkan graphics-compute and general API tests | OpenCL / Metal / Vulkan compute scores | Quick heterogeneous-compute and general GPU compute assessment across devices |
Everything you need to know about running the benchmark and understanding the result.
Still have a question? Get in touch →Nothing to install — the benchmark runs entirely in a modern browser using WebGL, with no downloads, extensions or accounts. Before the run we record the GPU renderer string, browser and OS versions, resolution and refresh rate locally, for display and comparison only — it is never uploaded as test data. The site itself uses third-party analytics to count visits, described in the privacy policy; blocking it does not affect the test.
Desktops, laptops, phones and tablets can all run it, as long as the browser supports WebGL with hardware acceleration enabled — the latest Chrome, Edge, Firefox or Safari is recommended. On mobile devices, landscape mode, a power connection and a stay-awake screen are recommended; older or heat-prone devices can start with the lightest Simple preset.
It creates a sustained graphics workload, similar to a demanding game. Your device may get warm and its fans may speed up. You can stop at any time.
Power mode, thermals, background apps, hardware acceleration, drivers and screen refresh rate all affect results. Plug in, close GPU-heavy apps and keep the tab in the foreground.
Startup involves shader compilation, driver loading and GPU clock ramp-up; the end of a run is prone to scheduling and teardown noise. We discard the first and last 5 seconds and score only the stable 60 seconds in between.
Yes. Browser frame rate is capped by the display, and 60Hz and 144Hz screens have different ceilings. We record refresh rate and flag results that look capped.
1% Low converts the average of the slowest 1% of frames into an FPS value and reflects sustained stutter. Minimum FPS is the single slowest frame and is easily skewed by one-off events.
Update your browser, enable hardware acceleration and check your graphics drivers. The test page checks the environment before starting.
VolumeShader_BM is a browser GPU benchmark that renders a ray-marched Mandelbulb fractal and measures frame rate. You will also see it written as volumeshader_bm, volume shader bm, volumeshaderbm or VSBM. The colourful mushroom-shaped fractal earned it a Chinese nickname meaning "poison mushroom test", which is sometimes rendered literally in English as "Poisonous mushrooms test". All of these refer to the same benchmark, and this site keeps the original open-source fractal shader unchanged.
70 seconds, no install. The run and all calculations stay in your browser.
Checking whether your device can run the test…
The information above stays on your device and is never uploaded as test data.
The test creates a sustained graphics load and your device may get warm; on mobile, plug in and keep the tab in the foreground.
Software rendering detected. Results are of limited value and will never be ranked.
Your browser could not create a WebGL context. Update your browser, enable hardware acceleration and check your graphics drivers, then try again.